vSphere 7 03 Monitoring
11 Jun 2022
Resources:
- VMware Pathfinder
- Lab: Introduction to vSphere 7 Performance
- Lab: vSphere Performance Testing of ESXi Host Subsystems - Module 1
- The CPU Scheduler in VMware vSphere 5.1
- vSphere Resource Management - VMware 7.0
- ESXTOP Cheatsheet
vSphere CPU Scheduler
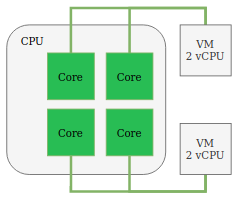
CPU scheduler spreads virtual machines across multiple physical processor cores.
Terms
- A world is a thread of execution (processes that an ESXi host are running expressed as NWLD)
- A VM includes multiple worlds
- Symmetric Multi-Processor (SMP) - Allows ESXi hosts to support VMs with multiple CPUs.
- CPU Affinity - Bonds a VM to a specific processor, removing vMotion and HA.
- ESXTOP - Command line tool used to analyse performance.
VMs are allocated vCPUs and multiple VMs can share the EXSi host physical CPU cores.
Under the hood the ESXi host will load balance the cores, which optimises the use of the physical cores.
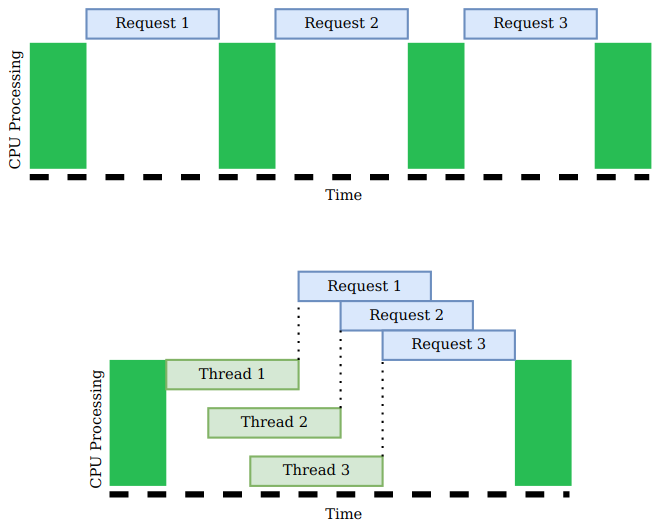
Hyper-Threading is a form of parallelisation. Threads are processed in parallel by different CPU cores to save time.
The figure below is an illustration of a CPU clock time. The top diagram shows a non-hyper-threading CPU, each request is processed one after anther.
Whereas the hyper-threaded CPU can split the CPU into threads and start processing the requests, resulting in a shorter completion time.
Right sizing Virtual Machines
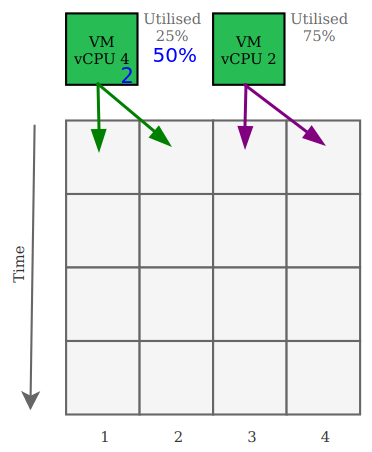
Based on vCPU utilisation, having correctly sized VMs allows for a more efficient use of the physical CPU cores and improve clock time usage.
In the figure below, if the first VM, which has 4 vCPU and only utilises 25% is reduced to 2 vCPU, the utilisation would increase to 50% but the CPU clock would be in a better place and typically improving performance of both VMs.
- vCPU ready - ready to process, but queued. This is expressed as “%RDY” in ESXTOP.
- CoStop - Threshold of CPU skew reached, CPUs being placed on hold. This is expressed as “%CSTP” in ESXTOP.
Memory Virtualisation
Memory in Virtual Machines is thin provisioned and can be over provisioned. Memory pages are mapped between the VM and the physical host but requires a reclaim mechanism when memory is no longer used.
A memory reservation can be created, and will guarantee the physical memory. Reservations often cause wasted memory on the physical host.
Performance Charts
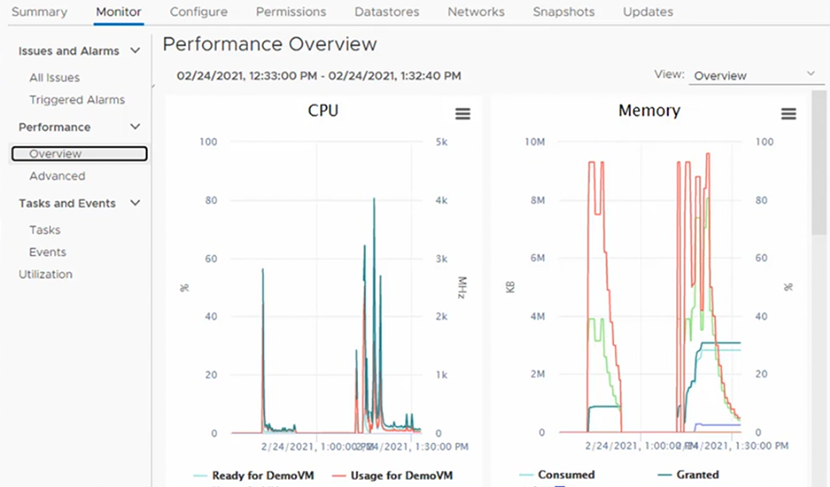
Navigate to VM > Monitor > Performance > Overview.
The overview graphs provide a high level view, and can be extremely useful to understand if the resources are being utilised efficiently or if there are bottle necks, such as CPU Ready.
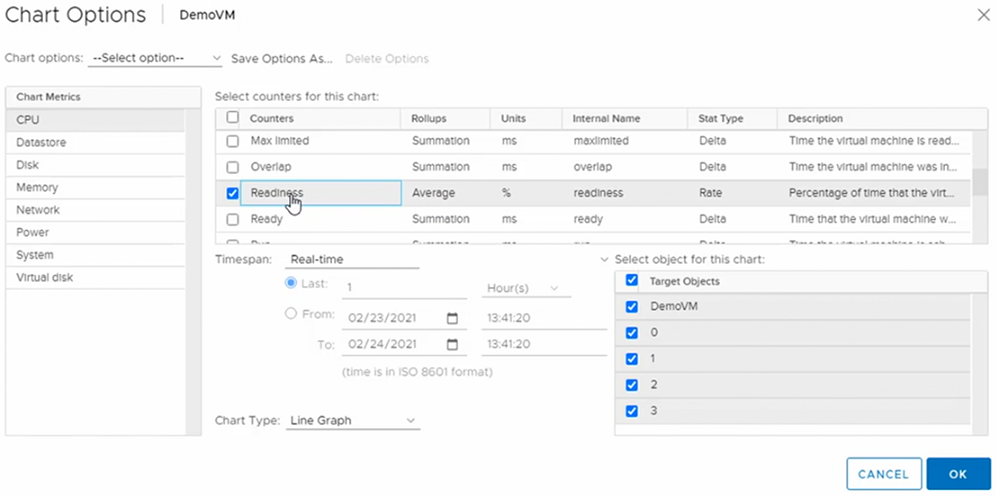
The advanced charts provide more details, allowing us to focus on a specific set of data for example the “Readiness”.
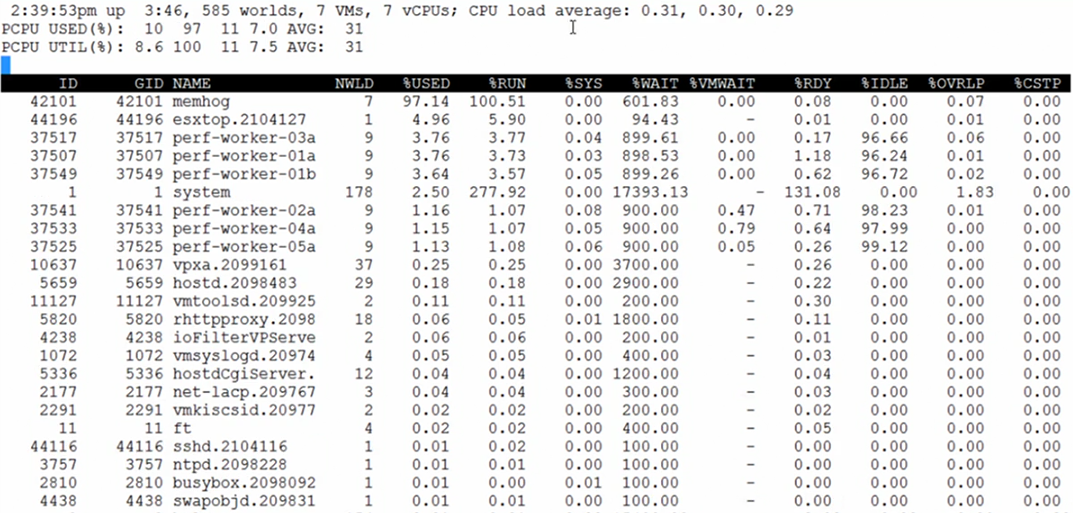
ESXTOP
ESXTOP is a command line tool used to analyse performance, similar to top for Linux.
Switch display:
- c - CPU
- i - interrupt
- m - memory
- n - network
- d - disk adaptor
- u - disk device
- v - disk VM
- p - power management
- x - vSAN